← Back to Archive Index
EVMonitor.info Archive
This article is part of an archived collection from Nikolay Shishkov's blog about first-generation electric vehicles, battery maintenance, modifications, and repairs. Nikolay was an EV pioneer who passed away in 2025. His technical knowledge and generous sharing of information continues to help the EV community.
Graphing of a charging of Think A306
By Nikolay Shishkov • March 21, 2016
charginggraphlogThink A306think evZebra battery
Edit @2016-04-01: Updated with a corrected graph.
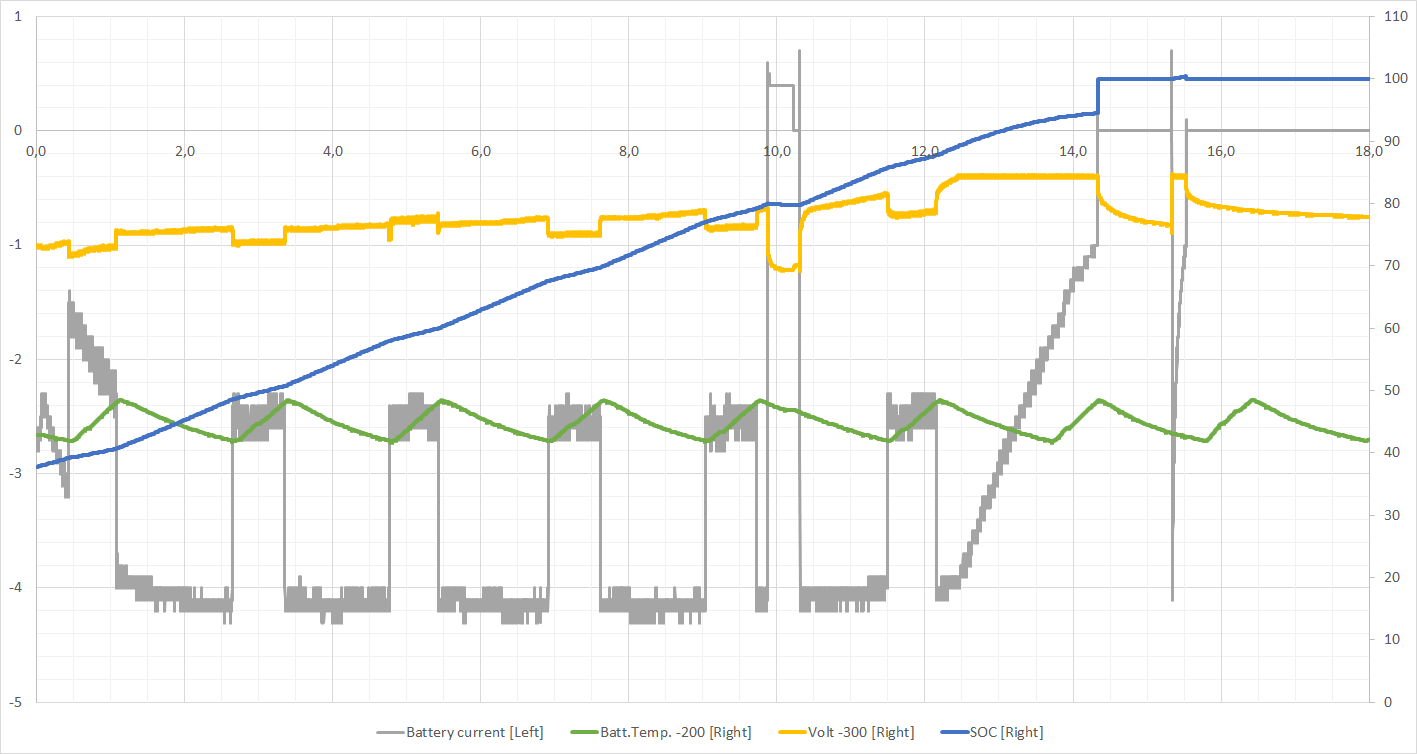
I took this log during a charging from about 35% to full on a Think City A306 with Zebra battery. The battery was relatively new.
- I thought that the charging was with relatively constant current... but I was surprised to see the current to the battery shift between 4.2A and 2.5A during a charge. Initially I thought that the battery had a problem or that the charger had thermal issues... but then I saw the graph of the battery temperature (in green) and realized that while heating the battery consumes current for the heating process and then there is no more current available for the charger.
- The final constant voltage phase of the charger is very visible - the current goes from about 4A to 1A and then drops directly to 0A.
- Also visible is the pause at 80% for Voltage at Rest measurement. For about 20 minutes a small current of about 0.4A was drawn from the battery to "neutralize" the effect of the charging.
- Another visible part is the reset of the SOC when the current drops to 0 after the constant voltage phase. The calculated SOC was around 94% when EOC (end of charge) was detected and the SOC was reset to 100%.
- Approximately 1 hour after the EOC, another short charging period was made.
To ease the reading of the graph: the battery current is between 0A and -4.2A, SOC is between 40% and 100%, battery temperature 240C and 250C, battery voltage 369V and 384V.
Feel free to post comments/questions.
← Back to Archive Index